

Mission 18 · Energy
Virtual Power Plant: Energy analytics web app
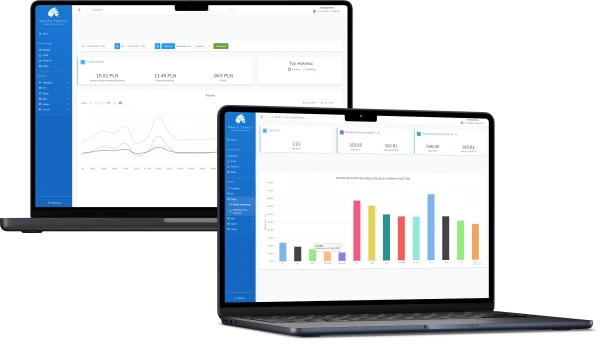
A web app for Naatu, a Polish energy company, that turned readings from its energy meters into charts and reports: energy use and solar production, costs under different tariffs, and the quality of the power supply. We built it in 2021–2022 together with Plishka, Naatu's mobile app for households, and both launched in April 2022.
- Client
- Naatu
- Industry
- Energy
- Platform
- Web
- Built with
- React, Node.js, PostgreSQL
01 · Business context
The problem
Naatu's meters collected detailed data about energy use and solar production, and the client needed that data turned into charts people could read.
Naatu wanted two apps for managing energy use: Plishka, a mobile app for single households, and Virtual Power Plant, a web app for detailed analysis of data from electricity networks, for business or personal use.
The web app had to plot one or many kinds of data over any time range. It also needed tools for saving energy: cost calculations, a comparison of tariffs and a detector of instability in the network.
The client
Naatu
An energy company from Gdańsk, Poland, focused on saving and storing energy. Today it offers a home battery and EV chargers, and connects homes with solar panels, heat pumps and batteries to a virtual power plant.
Naatu asked us for both apps at once. Plishka covered single households; Virtual Power Plant covered detailed analysis. We built them in parallel, on one backend.
02 · Key features
What we built
A React web app with MobX and Highcharts, on a Node.js and PostgreSQL backend that also served the Plishka app. We proposed the architecture: one sign-in service, one data API and one Strapi admin panel for both apps. These were its most important features.
-
Charts of meter data
Users picked a meter, a time range and a resolution down to 15 minutes, and plotted one or several kinds of data on one chart, with zoom.
-
Costs and tariffs
The app calculated energy and distribution costs and showed what the same use would cost under each tariff, so users could choose a cheaper one.
-
Solar production
Separate views showed how much the solar panels produced, how efficiently, and how production compared between periods.
-
Power quality
Reports on phase voltages, power demand, voltage dips and harmonics, and a detector of instability in the network.

03 · Results
What changed
Virtual Power Plant launched in April 2022, about a year after the work began, at the same time as the Plishka mobile app.
Key achievements
- Launched in April 2022, at the same time as the Plishka mobile app.
- One backend served both apps: a shared sign-in service, data API and Strapi admin panel, on an architecture we proposed.
- One team built both apps in parallel, in one code base.

More missions
Browse the portfolio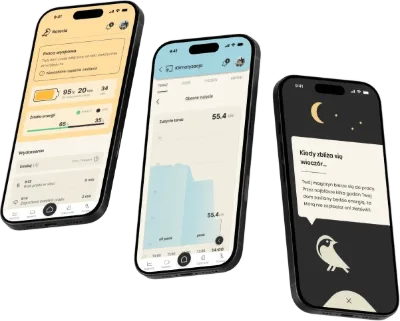
Next mission: yours.
Bring an idea, a half-built app or a live product. Start with the mission brief: it takes two minutes, and our team replies within 8 working hours.